Seeing Double
A reader’s guide to the new public country-by-country reports
For the past decade, big multinationals have told tax authorities privately how much profit they booked and tax they paid in each country. Now, thanks to a European Union directive, the rest of us will get to see some of that same information too. The first public “country-by-country” reports are out, and large U.S. multinationals like Microsoft, Procter & Gamble, and Sysco are among the first to publicly report. These reports are a step forward for tax transparency, but this step is not without pitfalls. As someone who regularly reads tax filings for “fun” (yes, I’m that nerd), let me walk you through what these reports do—and, more importantly, don’t—tell you.
What is this report?
Country-by-country reporting grew out of a global project to curb corporate tax shenanigans that shift profits to low- or no-tax jurisdictions and erode every other country’s tax bases. For a decade, multinationals have filed a private version with tax authorities. The EU’s new rules make a public version mandatory. For each country in which a multinational operates, you get a handful of figures: revenue, profit before tax, income tax paid in cash, income tax accrued, accumulated earnings, and headcount. These figures give you a rough map of where a company books its business and where it pays its tax.
Rough is the operative word. It’s a useful map. But there are limits to its usefulness. The methods appropriately used by firms complying with the directive can distort the figures significantly. Think of it more like a map without a scale bar, and sometimes the same roads can be drawn three times.
What happens when you add but never subtract?
When your company reports a single profit number to shareholders, accountants first “consolidate” the profits of all of its subsidiaries. This is different from just summing them together. Consolidation means canceling out all the sales, royalties, loans, and dividends the company’s own subsidiaries paid one another. They do this because a company can’t get richer by selling to itself, any more than moving twenty dollars from your left pocket to your right makes you twenty dollars richer.
To reduce the compliance burden on companies (who don’t necessarily consolidate on a country-by-country basis but rather on a global basis), these country-by-country reports do no such canceling. They take the standalone accounts of every entity owned by that multinational in a single country (often dozens), add them together, and move on. Every internal transaction that consolidation would have erased stays in. So one real dollar of business can be counted twice, three times, or more.
Picture a drug produced by a US pharmaceutical company that has operations in Ireland, France and the Netherlands. A wholly owned factory in Ireland makes the drug and “sells” it to a sister company in France for $100. The French affiliate sells it to an actual customer for $100. One real sale to one real customer—but the report now shows $100 of revenue in Ireland and $100 in France.
It gets worse. Often there are other entities in the structure of the company for a variety of tax and non-tax reasons. So now let’s add a Dutch holding company that fully owns the French affiliate. Accounting rules may require the Dutch holding company to reflect the French affiliate’s $100 as its own “equity” income – income it earns by virtue of its ownership of the French affiliate. Now the same $100 has been counted three times across three countries (see figure below). No tax haven required. No sophisticated tax shenanigans. Just companies following the rules and arithmetic that never subtracts.
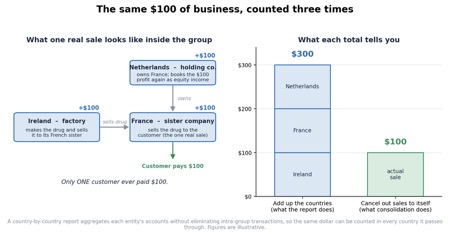
This latter issue of double-counting France’s $100 sale in both France and the Netherlands, as well as misattributing the $100 sale to the Netherlands, is the issue raised by accounting researchers Jennifer Blouin and Leslie Robinson in a 2025 study: income earned by an operating subsidiary is counted again in every holding company sitting above it. The stakes aren’t small. When the authors revisited an influential estimate that pegged annual U.S. revenue losses from profit shifting at $77–111 billion and corrected it for this double-counting and misattribution, the number fell to about $11 billion. Same data. One accounting fix. An order of magnitude difference.
What does this look like in the wild?
When inspecting these reports looking for shady tax shenanigans, you might think you see a smoking gun if you find a country where profit rivals or exceeds revenue and you could fit the entire workforce in my campervan. In Microsoft’s report, Luxembourg shows $199 million of revenue but $283 million of profit, with 34 employees. Profit larger than revenue is a neat trick, but this “profit” could mostly be dividend and equity income from other parts of the multinational group that already counted that money where it was actually earned. Sysco’s Netherlands entry is $114 thousand of revenue, $21.7 million of profit, and one employee. Determining how much of this reflects the types of profit shifting and base erosion public country-by-country reporting was supposed to surface, versus artifacts of the accounting behind the numbers, requires a lot more digging. Further, we may not have enough information to really tell in the end.
Oh, is that all?
Nope. Counting the same figure multiple times and in multiple places is a big issue, but there are other obstacles to be aware of.
Revenue isn’t sales to customers. These revenues on country-by-country reports include sales to the company’s own affiliates, so you can’t sum it across countries to recover the group’s real top line, and it won’t match the revenues reported to shareholders in the company’s annual report.
Profit before tax isn’t taxable income. Another shortcut the rules let companies take is to use book income, or income computed under financial accounting rules instead of tax rules. These rules differ for a variety of good reasons, such as not overstating profits to shareholders and using deductions or credits to incentivize corporate investments. Divide the tax line by these profits to get an effective tax rate and you may be misled. Dividend income, for example, may be included in profits, but this type of income is often deliberately taxed lightly (so you’re not taxing the same earnings twice). This could result in holding companies within multinational groups looking like they pay near zero. That’s the law working as designed, not a smoking gun.
How much did they pay in tax? Tax paid, tax accrued, and tax owed on this year’s income are all reported, and they are three different things. Microsoft’s France line shows negative $96 million of cash tax (a refund of an earlier overpayment) against $131 million accrued. P&G paid $3.3 million in Germany while accruing $80.5 million. One year’s cash tax number, read alone, can be very misleading.
Most of the planet is one line. The EU rules require country detail only for EU member states and a short blacklist. Everything else—including the United States—gets swept into a single line called “all other tax jurisdictions.” For Microsoft, that one line holds $279 billion of revenue and roughly 199,000 employees. So the report really just mostly shows you Europe.
Do companies help explain all this?
Some of it. Microsoft published a companion “context” post. Frankly, I expected this to be a way the company could wave a shiny object at readers in the hopes of redirecting our attention away from the numbers, but it’s genuinely helpful. It explains why cash tax and accrued tax differ (that France refund). And it warns that the report combines all of Microsoft’s legal entities in a country under EU rules that differ from U.S. accounting rules. These are helpful explainers.
But companies could explain more. Microsoft never mentions that combining-without-canceling double counts, or that you therefore can’t add the countries up. Instead it pivots to the spin machine I was anticipating: $176 billion of capital spending, $89 billion of research, and the second-highest income-tax payer in the S&P. All may be true. None of it helps you interpret the report. It’s the tax equivalent of answering “how big was the tip?” with “well, I’ve been a loyal customer for years.”
So, useless?
Not at all. These reports are a real step forward, and the motivation behind them to show where profit lands and tax gets paid is generally a good one. But they’re working documents for tax authorities, dressed up for the public and shipped without a scale bar. Read them for what they are: a jurisdiction-level sketch in which the same dollar can appear several times, “revenue” and “profit” don’t mean what you think, and one line summarizes most of the world. Treat any figure that seems indicative of shenanigans as a hypothesis, not a verdict.
The reports are well worth reading. They’re just not worth reading quickly.