An inequality measure tax policy tends to overlook
When politicians argue about inequality, the focus tends to be on two numbers: the income gap and the wealth gap. Debates over recent federal legislation, including last summer’s One Big Beautiful Bill Act, have played out largely along those lines. Another measure is arguably closer to welfare, and it deserves more airtime than it tends to get. That measure is consumption inequality.
Income tells you what flows in. Wealth tells you what is stored up. Consumption tells you what is used: the food on the table, the car in the driveway, the school supplies in the backpack. Income fluctuates, and households smooth it with saving and credit. Wealthy households accumulate much more than they spend. Consumption sidesteps both issues and gives a more direct view of what households actually benefit from today.
Three measures, three stories
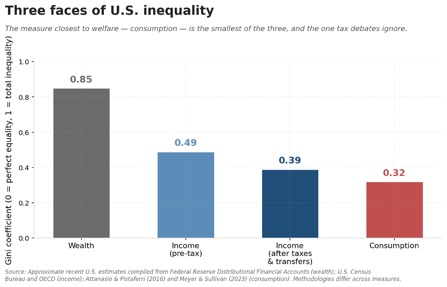
Consider three primary inequality measures side-by-side. Wealth inequality in the U.S. is high, with a Gini coefficient of roughly 0.85 based on Federal Reserve Distributional Financial Accounts. Income inequality is large but smaller. The Census Bureau put the pre-tax household Gini at 0.49 in 2024, and taxes and transfers bring it to about 0.39. Consumption inequality tends to be the smallest of the three, at around 0.32 in recent U.S. estimates (Attanasio and Pistaferri, 2016; Meyer and Sullivan, 2023). This is because savings, credit, and transfers act as shock absorbers. When those absorbers are limited, income and wealth shocks pass more directly through to consumption. As such, consumption can provide a more complete picture of a tax policy’s distributional effects.
What state corporate-tax changes reveal
Tax-policy debates often treat consumption as a downstream consequence of a reform’s income- or wealth-distribution effects. The incidence literature has tried to apportion the corporate-tax burden across firm owners, workers, landowners, and consumers, with estimates that vary across studies. Suárez Serrato and Zidar (2016, 2023) attribute roughly 35–40 percent of state corporate-tax incidence to firm owners and about 30–35 percent to workers. Landowners absorb most of the rest. Fuest, Peichl, and Siegloch (2018) put the worker share closer to half in German data. Baker, Sun, and Yanelis (2023) estimate that close to half of the incidence falls on consumers through changes in prices.
These shares describe who pays in aggregate. They do not tell you how much a given household ends up absorbing through higher prices, lower wages, or smaller dividends. In recent work with Yiyuan Wang and Yuqing Zhou, we find that the sum can be substantial and unevenly distributed. This is true even though no household is billed directly.
We study state corporate-tax changes between 2004 and 2019. Our household consumption data come from the NielsenIQ Consumer Panel, which captures roughly 50,000 U.S. households that scan their retail purchases each year. A one-percentage-point rise in a state’s corporate income tax rate is associated with about a 0.4 percent decline in household consumption, on average. The more interesting question is who the average is averaging over.
When we split the sample, the headline number looks much less uniform. Pooling corporate-tax changes in the data, non-white households’ consumption falls by roughly 1.1 percent for every percentage point increase in the corporate rate. The response of white households is statistically indistinguishable from zero. Households whose heads both lack a college degree show a similarly amplified response, as do those running tighter on liquidity (Figure 2). German evidence on the wage channel points in a similar direction. Costs appear to fall harder on low-skilled, young, and female workers (Fuest, Peichl, and Siegloch, 2018).
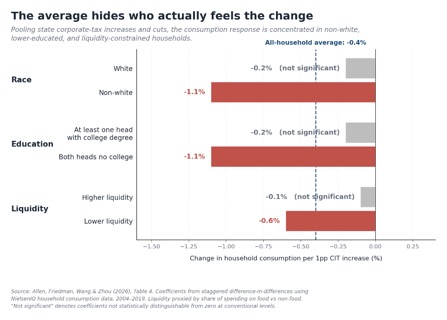
The pullback concentrates in non-food and higher-priced product categories, the kinds of goods that financially squeezed households tend to cut back on first. Aggregate consumption inequality rises measurably. A tax that no household is directly billed for seems to widen the gaps between households.
Every fiscal lever has a consumption footprint
Most fiscal levers have some consumption-inequality footprint, and it often differs from the headline impact on income or wealth. A wealth tax like the Ultra-Millionaire Tax Act, which Senator Warren recently reintroduced, compresses wealth at the top. Its effect on consumption inequality is harder to pin down. The wealthiest households do not spend in proportion to their fortunes. Much of the welfare effect would run through what the revenue ends up funding.
A top-bracket income tax cut lifts after-tax income at the top. It tends to show up only weakly in consumption inequality, since high earners save much of a windfall. Still, it moves the income-inequality number that political debate often fixates on. A consumption tax like a VAT or sales-tax hike lands more directly on spending. It is often regressive, since lower-income households spend a larger share of their income than higher-income ones.
Other policies affect distribution more indirectly: the state corporate taxes we study, Federal Reserve interest-rate decisions, and tariffs. The JCT and CBO publish distributional tables for major bills, but those tables sort taxpayers by income. Adding a consumption-distribution column could shift the rankings in some cases. A reform that compresses income inequality while widening consumption inequality may not be what most voters think they are voting for.
Income is what your paystub shows. Wealth is what your bank statements show. Consumption is closer to what you actually experience: what you eat, what you drive, what your kids wear to school. If one inequality measure deserves a bigger share of policymakers’ attention, it is arguably the one closest to that experience.
REFERENCES
Allen, E. J., H. L. Friedman, Y. Wang, and Y. Zhou. 2026. “Corporate Income Tax Rates and Household Consumption.” Working paper. Available at SSRN: https://ssrn.com/abstract=5850764.
Attanasio, O. P., and L. Pistaferri. 2016. “Consumption Inequality.” Journal of Economic Perspectives 30 (2): 3–28.
Baker, S.R., Sun, S.T. and Yannelis, C., “Corporate Taxes and Retail Prices,” NBER Working Paper 27058 (2020), https://doi.org/10.3386/w27058.
Fuest, C., A. Peichl, and S. Siegloch. 2018. “Do Higher Corporate Taxes Reduce Wages? Micro Evidence from Germany.” American Economic Review 108 (2): 393–418.
Meyer, B. D., and J. X. Sullivan. 2023. “Consumption and Income Inequality in the United States since the 1960s.” Journal of Political Economy 131 (2): 247–284.
Suárez Serrato, J. C., and O. Zidar. 2016. “Who Benefits from State Corporate Tax Cuts? A Local Labor Market Approach with Heterogeneous Firms.” American Economic Review 106 (9): 2582–2624.
Suárez Serrato, J. C., and O. Zidar. 2023. “Who Benefits from State Corporate Tax Cuts? A Local Labor Market Approach with Heterogeneous Firms: Reply.” American Economic Review 113 (12): 3401–3410.