Is Big Oil “Taking the Money and Running”? Tax Footnotes to the Rescue
Does the U.S. inadequately tax major oil providers? Using new tax disclosure details from the financial statements of three U.S. oil majors (the TOMs), “Take the Money and Run…” makes this claim. Like many stories today, it employs exaggerated language to hook the reader – “Amid skyrocketing oil prices and concerns about ordinary Americans subsidizing Big Oil’s expected super profits at the pump, new disclosures show how the U.S. continues to inadequately tax its oil majors.” It certainly hooked me.
New financial accounting rules require companies to provide more details about where they pay income taxes. Accurate and relevant information increases the ability to make informed decisions, and influence others. Therefore, it is important to carefully examine claims based on the new details. Information is powerful. Do these disclosures “…show how the U.S. continues to inadequately tax its oil majors”? It is debatable. But the new disclosures provide a better understanding of where firms operate and incur taxes.
The good news is that information in the tax footnote allow us to see where the TOMs earn income and pay taxes. Data from the tax footnotes of the TOMs, summarized in Table 1, shows that they earned an average of 31% (69%) of their income in the U.S. (abroad). Tax expense is a function of taxable income and tax rates that vary by jurisdiction. For example, the top statutory rates across the countries cited in the article for the TOMs vary from around 23% to 85% for resource rich countries such as Norway and Saudi Arabia.[i] Combine higher foreign earnings with higher foreign tax rates and it is unsurprising that the TOMs pay more tax abroad.
In addition, the article cites data from new tax footnote disclosures that show actual tax payments in 2025 to the federal government are as low as 2% of all cash taxes paid for Chevron and are expected to average 6.1% of domestic book income across all three TOMs (emphasis added). While technically correct, the numbers are misleading for two reasons. First, they ignore payments to U.S. states in the numerator but include payments to the states in the denominator. While readers might approve kicking certain states out of the U.S., state governments are part of the U.S. and charge taxes on domestic income.
Second, financial statements report “book” income, not taxable income. Sovereign governments design tax systems to fund their operations and to encourage certain behaviors, such as investing in new assets. Each jurisdiction defines its taxable income and its tax rates to suit those revenue and behavioral goals. Because book and tax rules recognize items differently across time, it is important to include deferred taxes as part of a firm’s tax burden. They reflect the amount of tax expected to be paid in a different reporting period on the book income earned in the current period. Therefore, total tax expense more accurately represents the expected taxes on book income.
Adding payments to U.S. states and recognizing the importance of deferred taxes, the data reveals that in 2025 the TOMs actual taxes paid to the U.S. as a percentage of total taxes paid averaged 11% and ranged from 5% for Chevron to 25% for ConocoPhillips. The average amount they expect to pay on U.S. book income (U.S. total tax expense/domestic pre-tax book income) averages 15% across the three firms and ranges from 6% for Exxon to 26% for Chevron. Chevron’s low cash tax rate relative to its effective tax rate appears puzzling but further digging provides details. It relates to investing in depreciable assets, research and development, biofuel, and low carbon production, as well as net operating loss carryforwards and prior period overpayments. There is lots of information in those footnotes!
Table 1**
| 2025 Total for The Oil Majors (TOMs) ($Mil) | |||
| Pre-tax Book Income (PTBI) | Cash Taxes Paid | Total Tax Expense | |
| U.S. (Fed + State) | 23,155 | 2,710 | 3,535 |
| INTL | 50,512 | 20,979 | 19,895 |
| Total | 73,667 | 23,689 | 23,430 |
| % of Total PTBI | % of Total Cash Taxes Paid | Effective Tax Rate* (TTE / PTBI) | |
| U.S. (Fed + State) | 31% | 11% | 15% |
| INTL | 69% | 89% | 39% |
| Average ETR | 32% | ||
*U.S. (INTL) pre-tax book income for U.S. (INTL) calculation. Total PTBI for Average ETR.
**Source: 2025 Annual reports.
While inconclusive, research suggests that some firms have been decreasing their taxes over time, consistent with lower tax rates, additional tax incentives, as well as tax planning.[ii] However, the TOMs appear to have relatively high effective tax rates that vary over time, reflective of their rather volatile and risky industry. Some additional observations from the footnotes:
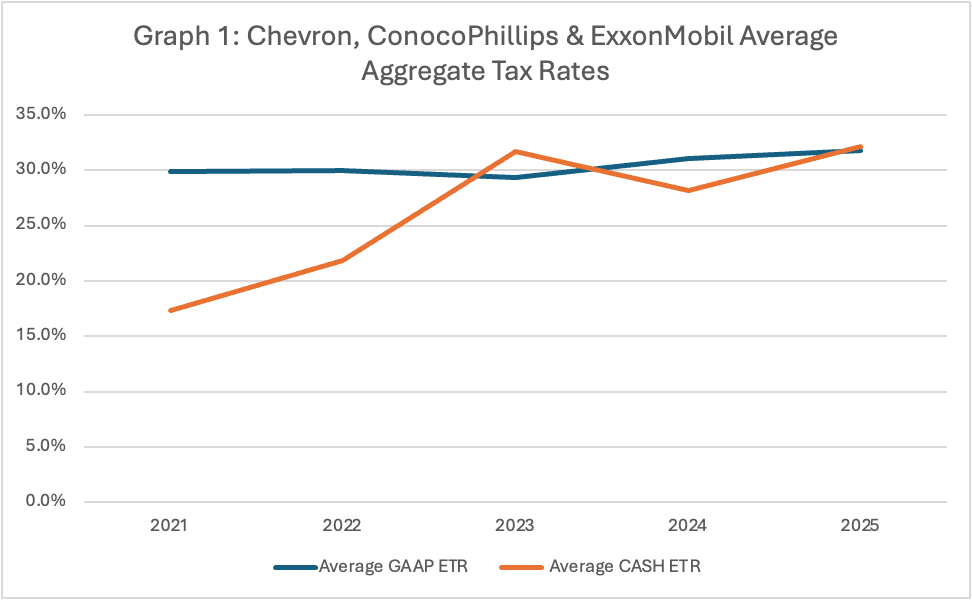
- TOMs worldwide effective and cash tax rates are high and vary across time as a percentage of their pre-tax book income (see Graph 1). Details in their footnotes suggest that a few jurisdictions contribute to effective tax rates exceeding the 21% U.S. federal rate. These include Norway, Libya, Australia, as well as Alaska and California. Further increasing costs in one jurisdiction can result in unintended consequences. California recently lost ConocoPhillips and Chevron.[iii]
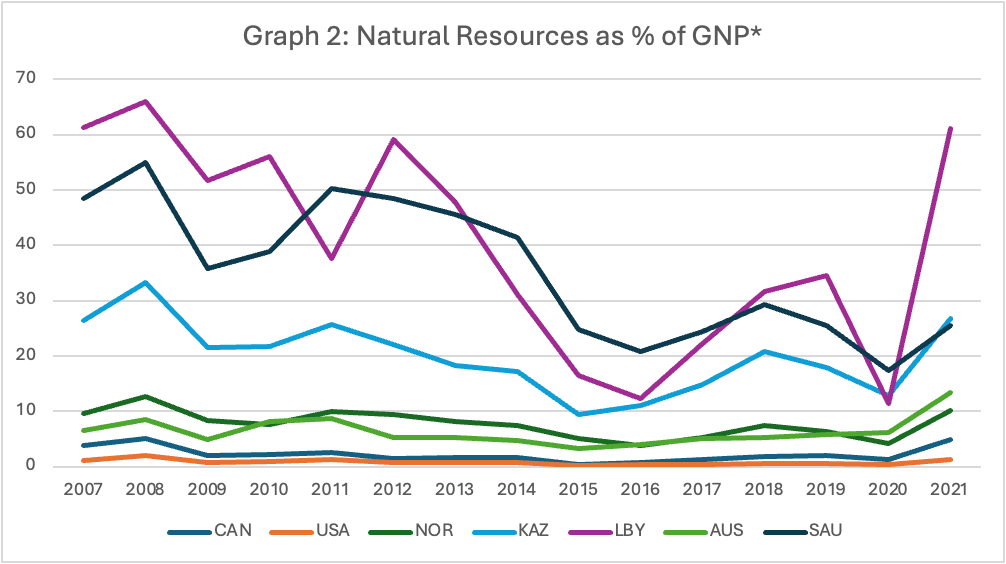
- The non-U.S. countries that TOMs pay substantial taxes to, as revealed in the new footnote disclosures, are more resource dependent than the U.S. The % of GNP derived from natural resources in these countries (Graph 2) is 3.8 to 47 times higher than in the U.S. and varies across time. Government revenues, employment, and economic well-being in these countries depends on natural resources, so it is not surprising that they charge higher tax rates to the TOMs. The U.S., thankfully, has a much more diverse economy.
- Finally, the tax footnotes show that the TOMs believe there is doubt about future taxable income. Each TOM has a substantial valuation allowance against their deferred tax assets (DTAs). DTAs represent future tax savings or prepayment of future taxes, and the valuation allowance suggests they do not think they will generate enough future taxable income in time to use their prepaid taxes. It turns out that doing business in certain parts of the world is quite risky.
There’s a lot of additional details in the tax footnote to ponder. The ASU 2023-09 disclosures clearly provide new and relevant information (Christiansen, Lynch, Nguyen, and Pflitsch 2025). However, it is important to understand any claims based on tax footnote information, especially when the claims are used to generate support for windfall profits taxes that appear on the heels of price spikes at the pump.[iv] These taxes never seem to work out as intended.[v]
In sum, the evidence from the TOMs financial statements does not support the claim that the U.S. inadequately taxes them. Yes, they pay more tax abroad. Yes, they are responding to tax incentives provided by the government. However, they earn more income in countries from where the resources are obtained, and those countries are more dependent on their natural resources. In addition, their overall tax burden is not low. Increasing their taxes because it feels like they are earning too much money might bring unintended consequences.
[i] Tax rates gathered using BlueJ AI (https://app.askbluej.com/) with sources listed below:
| Corporate Tax Rate (Federal + State Avg) | |
| US (Fed + State) | (21% + 6.5%*) |
| Australia | 30% |
| Canada | (15% + 8-16%) |
| Guyana | 40% |
| Kazakhstan (Note d) | 20% + |
| Libya (Note b) | Up to 65% |
| Nigeria | 30% |
| Norway (Note c) | 22% + 56% |
| Saudi Arabia (Note a) | 50% – 85% |
| UAE (Note e) | Up to 55% |
- For Saudi Arabia, the sources expressly identify a special oil and hydrocarbon production rate range of 50% to 85%, depending on capital investment, but they do not break that range down year-by-year within 2015-2025. The source presents that range as the applicable sector rule. [ Saudi Arabia – Tax Compliance Tables – Saudi Arabia]
- For Libya, the petroleum regime in the sources is not framed as a single standalone “corporate statutory rate” in the ordinary sense. Instead, the petroleum tax operates as a surtax mechanism that brings the total burden of specified direct taxes and charges up to 65% of petroleum income. [5] Libya – Corporate Taxation – Corporate Income Tax
- For Norway, the source describes the petroleum sector as subject to the normal corporate tax plus an additional resource-rent tax, with the effective resource-rent tax rate stated as 56% for petroleum production. That is not presented as a single unified statutory corporate rate for oil companies. [7] https://www.oecd.org/content/dam/oecd/en/topics/po…
- For Kazakhstan, the source describes oil and gas companies as subject to the general 20% corporate income tax plus additional subsurface-user taxes, excess profit tax or alternative tax in some cases, mineral extraction tax, and rent tax on export. It does not provide a single oil-company statutory corporate rate by year. [6] Kazakhstan – Corporate Taxation – Taxation of Special Types of Activity
- United Arab Emirates – Tax Compliance Tables – United Arab Emirates
[ii] For example, see Dyreng, Hanlon, Maydew, and Thornock (2017); Belz, von Hagen, and Steffens (2019). And Edwards, Kubata, and Shevlin (2021).
[iii] https://www.forbes.com/sites/rrapier/2024/10/17/why-oil-companies-are-leaving-california/
[iv] https://taxfoundation.org/research/all/eu/eu-windfall-profits-taxes-oil-gas-2026/
[v] Hodge (2024) provides an excellent discussion of the origins of excess profits tax (a Scandinavian stew tax in 1915, who knew?), why citizens support excessively high windfall tax rates, and why they are discriminatory, inequitable, and difficult to administer. Even my undergraduates love this book!
References:
Belz, T. , D. von Hagen, C. Steffens. 2019. Taxes and Firm Size: Political Cost or Political Power? Journal of Accounting Literature 42: 1-28.
Christensen, D. D. Lynch, A. Nguyen, and M. Pflitsch. 2025. Anticipating Change: Stock Market and Firm Responses to Disaggregation in Income Tax Disclosures (November 12, 2025). Available at SSRN: https://ssrn.com/abstract=5542138 or http://dx.doi.org/10.2139/ssrn.5542138
Dyreng, S., M. Hanlon, E. Maydew, and J. Thornock. 2017. Changes in Corporate Effective Tax Rates Over the Past 25 Years. Journal of Financial Economics 124 (3): 441-463.
Edwards, A., A. Kubata, and T. Shevlin. 2021. The Decreasing Trend in U.S. Cash Effective Tax Rates: The Role of Growth in Pre-tax Income. The Accounting Review 96(5): 231-261.
Hodge, S. 2024. Taxocracy: What You Don’t Know About Taxes & How They Rule Your Daily Life. Post Hill Press: New York, Nashville.